The Status Dashboard screen in Bongo IoT allows users to view all of their objects or assets in one place with all their details. Users can monitor and stay updated on object’s different parameters like GPS, Air Condition, Ignition etc.
To get started #
- Login to the mobile application.
- Go to
 screen.
.png?width=300&height=598&name=Frame%201218%20(1).png)
Below given are the color codes which denote the status of the parameters:
| Running Vehicles with their Ignition ON and are in a moving state. | |
| Idle Vehicles with their Ignition ON but are not in a moving state for specified period of time. | |
| Stopped Vehicles with their Ignition OFF. | |
| Inactive Vehicles that have not sent any data to the server for specified period of time. | |
| No Data Vehicles that have never gone live on the server. |
The user can view the status of various parameters like the Ignition, AC, Battery, Power, GPS, etc.
The status dashboard can also be viewed in Table form.
To change view #
- Click on
 icon on the top right corner of the screen.
 - Select View.
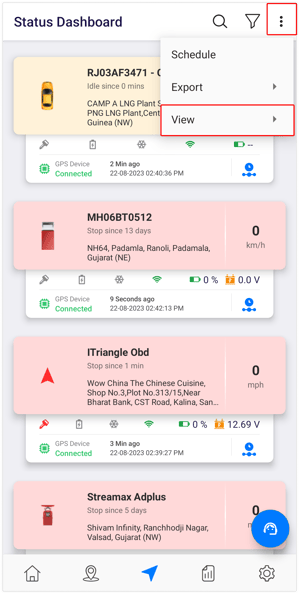
- Select Table.
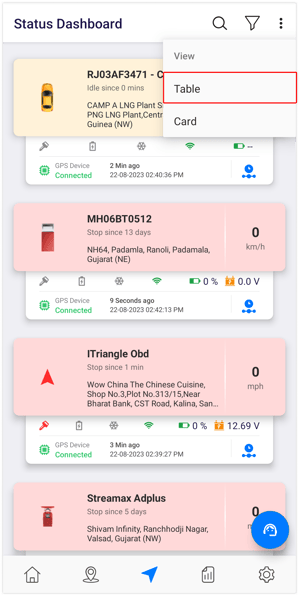
The new screen opens in the Table View for status dashboard.
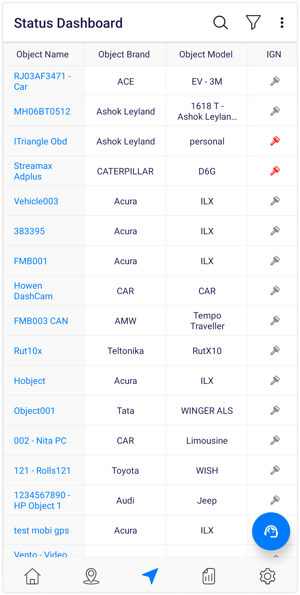
When the user clicks on the vehicle, the user will land on the live tracking screen to view the data of the selected vehicle.
Users can filter the data on status dashboard as per their preferences and requirements.
To apply Filter #
- Click on
 icon on the top bar of the screen.
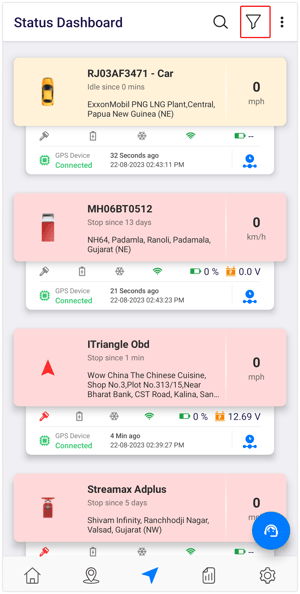
- Filter the data based on preferences.
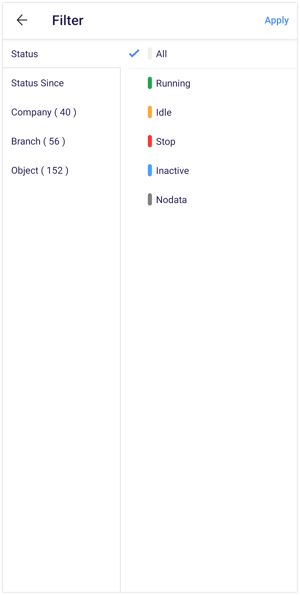
- Click on Apply.
There is also a provision of downloading reports.
To download reports #
- Click on
 icon on the top right corner of the screen.
 - Click on Export.
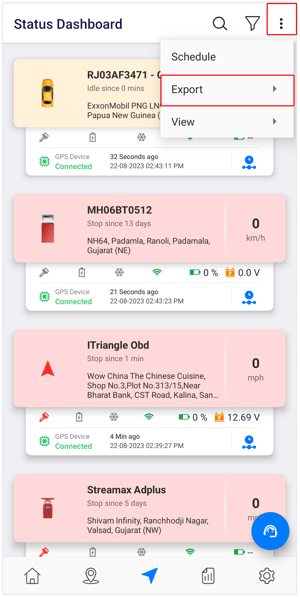
- Here the user can select the format in which the report needs to be downloaded:
PDF or XLS.
- Here the user can select the format in which the report needs to be downloaded:


